
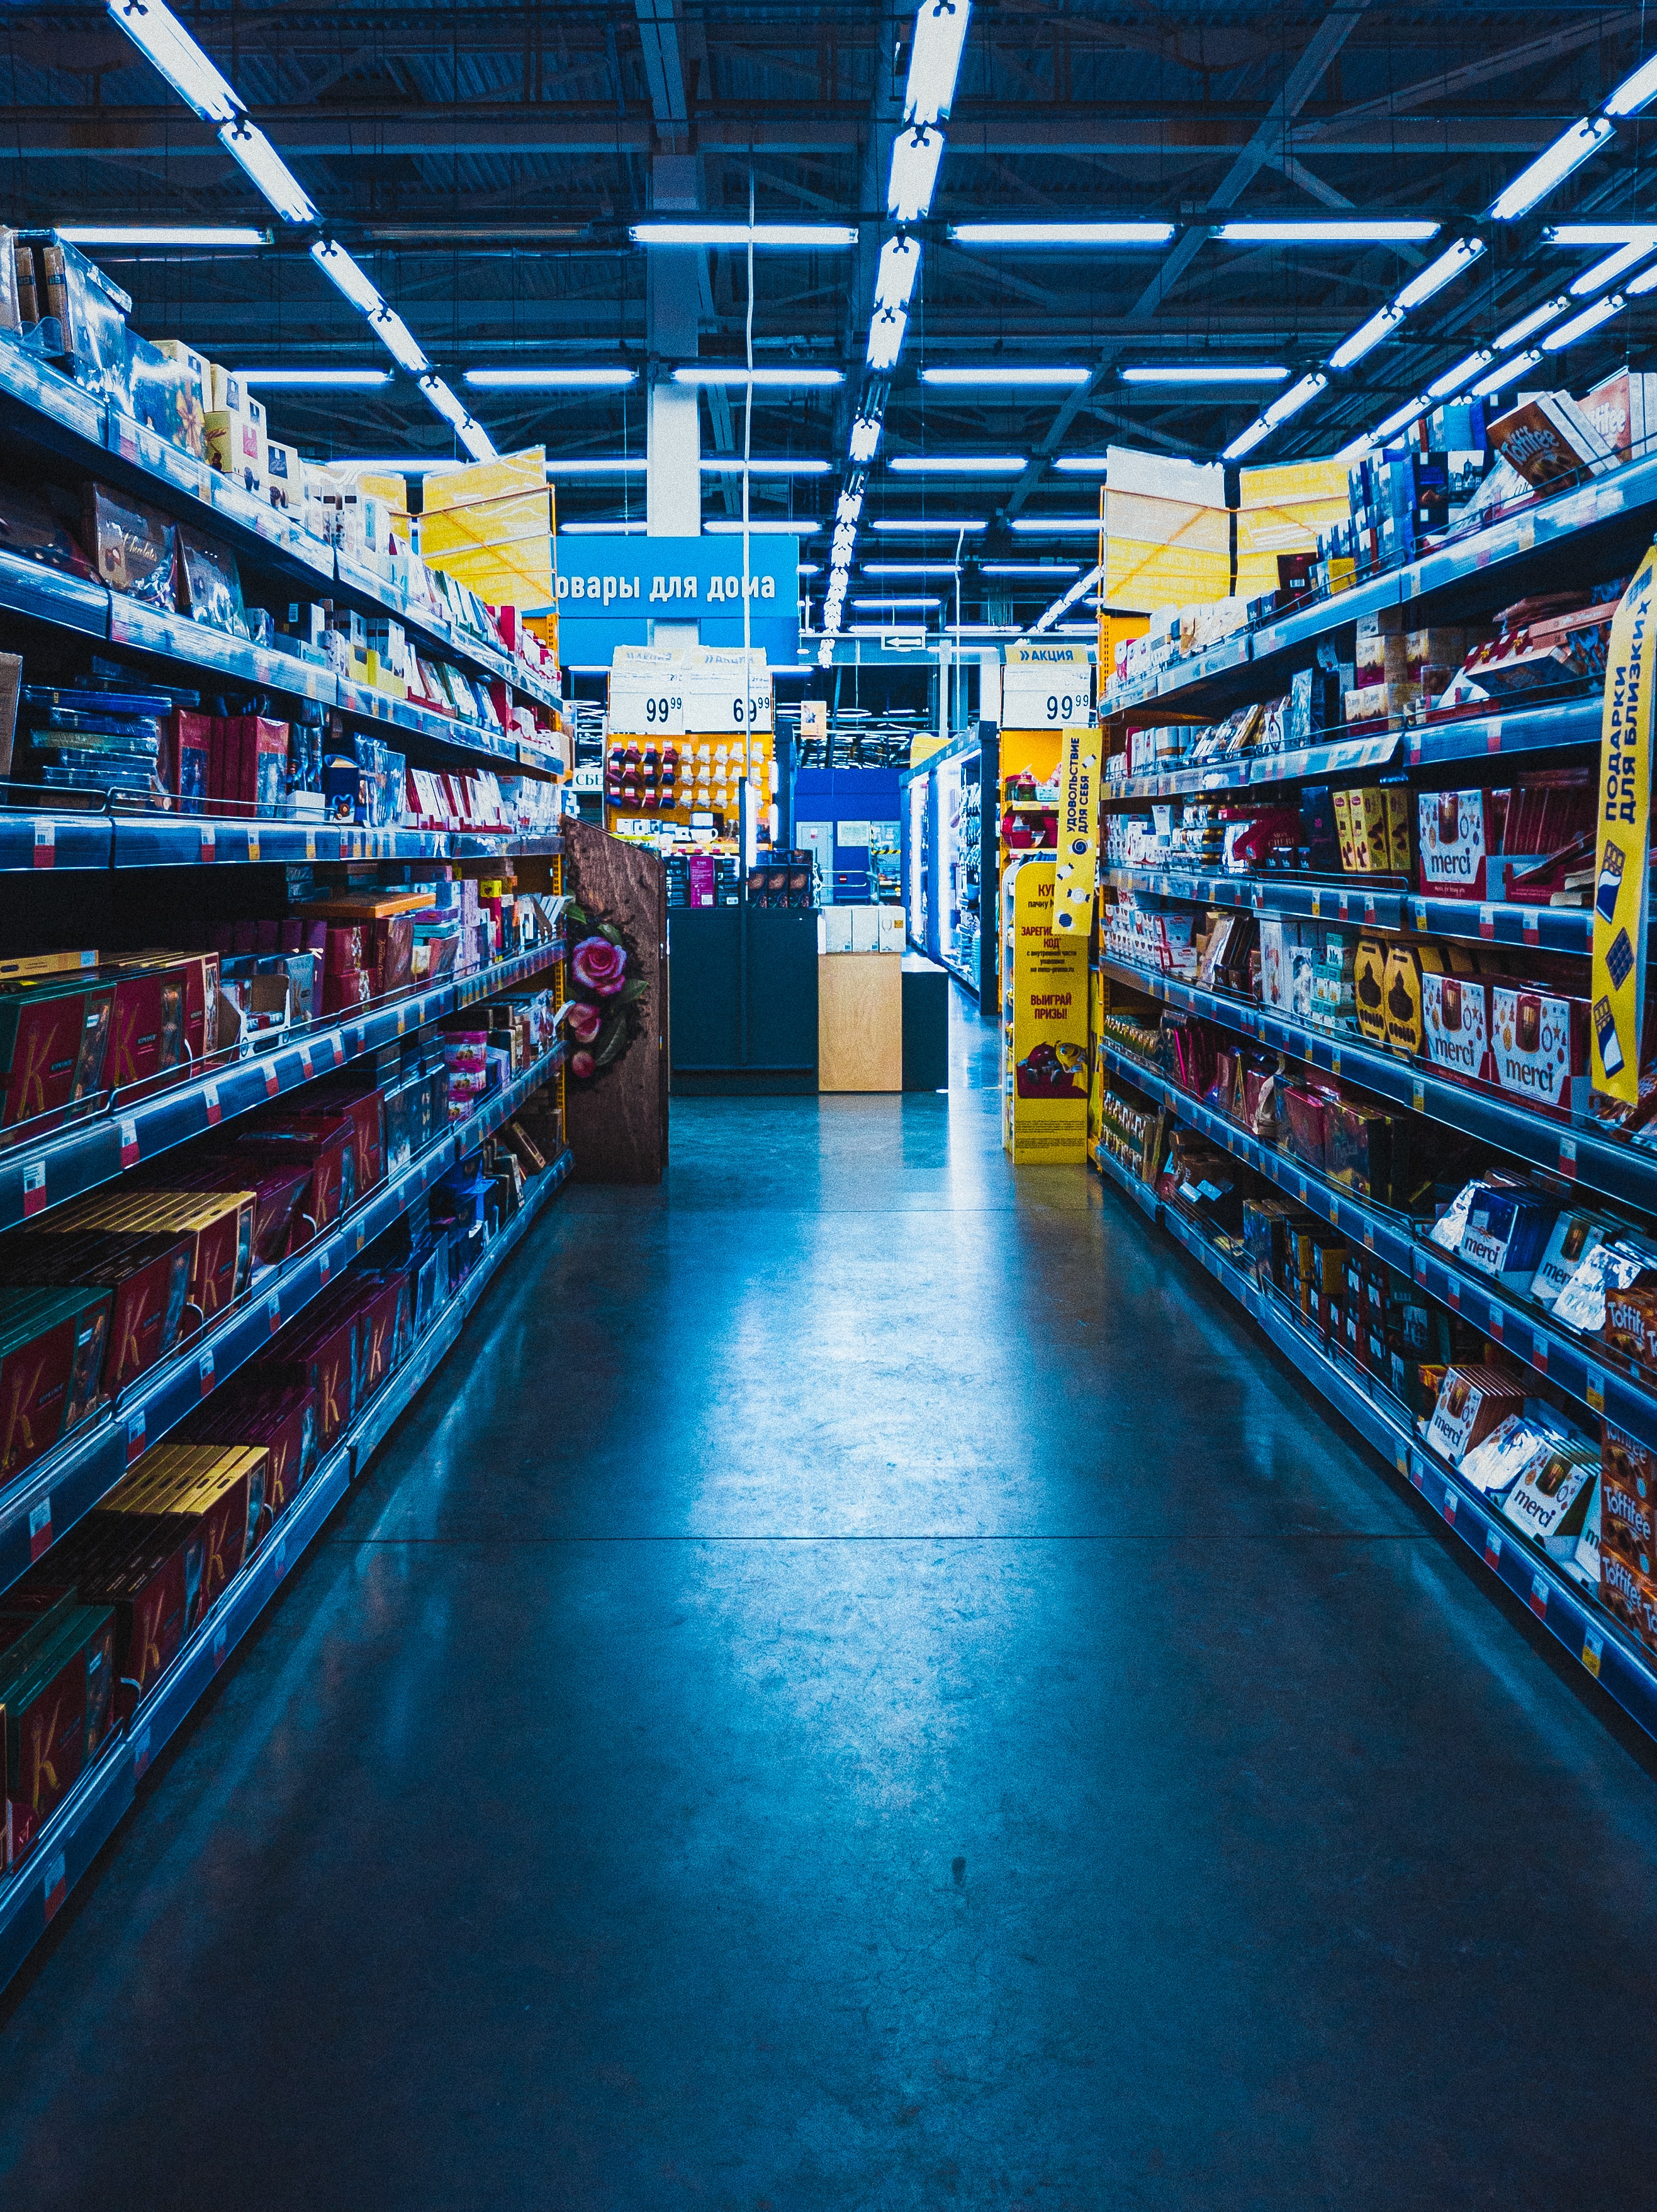
Secondary products displays and end caps are essential elements of a shopping experience. They are considered to be highly significant for product producers to be distinct and reach out to bustling in-store shoppers. Moreover, they are also the area where out-of-store marketing converges in-store marketing. So far whilst manufacturers and retailers have shown the positive influence of displays and examined the effect of pricing on shopper behavior, there is a shortage of data-driven observations on good details of display activity:
For instance:
Following the pandemic, the shopping time in grocery stores immediately dropped over 10% across all categories, thus, clearly indicating how external (outside) factors can influence shopper behavior in-store and where and when they are they are receptive to influence. In-store behavior analytics can bridge these gaps:
How:
By directly and unnoticeably measuring shoppers at the decisive moment.
Aim:
To show what matters most to shoppers at the point where they vote with their wallets, without the need to depend on their honesty or reliability.
Skips Crucial Points
Conventional market research methods, surveys and focus groups, for example, are good at monitoring consumer attitudes. Such information is usually associated with sales data (which monitors market factors). However, going directly from preference to sales indicates that you only understand what goes on inside the store itself. Nevertheless, with more than 70% of purchasing decisions said to have been made in-store, simply deducing in-store behavior skips the crucial points of likely influence for most shoppers. Moreover, direct methods like, shopper intercepts or shop-alongs can be lacking, due to shoppers acting differently when they are being watched. At times, they simply may not be able to recall the precise details of their shopping that are required to give good data.
Inventory management in supermarkets can help increase sales and track stock levels with our powerful stock management system, order fulfillment, and inventory control. Our clients include well-known brands from different market sectors, including Food and Beverage, Retail Stores, Real Estate, Tourism and Leisure Outlets, Beauty Spas, Medical and Educational Institutions, as well as Finance and Banking.
Reach Shoppers
Displays are amongst the most direct in-store applications when it comes to shopper marketing. It is one area where any retailer/product maker/brand can reach out to shoppers in-store on their own terms. Additionally, displays provide a number of uses in grocery stores including; encouragement of spontaneous purchases, reminder to shoppers about a product later on in their shopping trip, promoting the finding of latest products and providing for bargain-seeking shoppers. All these behaviors work to make baskets without necessarily disassembling primary aisles for these categories, bringing about a win-win situation for manufacturers and retailers.
Three Standards
Three standards direct total display performance; inclusive of additional sales created by the display and the display’s power to drive traffic to the main stocking place of the displayed categories; to evaluate the value of the display in its place. The three standards include:

1) Rate of exposure
Measures the number of traffic passing a specific location relative to total traffic of the store. This standard can be used to contrast locations in a store to decide which ones get more traffic.
3) Relative directional traffic flow
Measures the amount of a location’s traffic approaching another particular location. This standard can be used to find out the traffic dynamics with regards to the promoted product’s main location or even a complementing product/category. For example: A display of salsa can be used to inspire shoppers to visit ABC brand display having tortilla chips (complementary item).
Based on Myths
According to research, a display location can influence its performance by approximately 600%. Despite that, assigning display locations to certain promotions is usually based on folklore, not on facts and figures. There are two significant additions to the industry’s perception of display location performance: - Some display locations are essentially more valuable as compared to others - Display performance relies on stocking locations of the displayed products In the absence of research backed by data, manufacturers are just assuming the ideal location for their display and retailers are simply predicting the value of their display spaces.
Inventory management in supermarkets can help increase sales and track stock levels with our powerful stock management system, order fulfillment, and inventory control. Our clients include well-known brands from different market sectors, including Food and Beverage, Retail Stores, Real Estate, Tourism and Leisure Outlets, Beauty Spas, Medical and Educational Institutions, as well as Finance and Banking.
Location Best Practices
Manufacturers and retailers need to examine the efficiency of different display locations utilizing in-store behavior analytics as well as proposing substitutes to current display ideas. The end return: A set of location best practices that can be widely implemented by the sales group when bargaining trade marketing. For instance; to assist a new product’s launch, a manufacturer might opt for an endcap on the main category aisle to emphasize the new product to loyal customers. Alternatively, setting up a secondary display in high-traffic location or close to a complementary item might also prove to be fruitful.
Nearer to Accurate Motives
In-store behavior analytics can offer insights that are required to improvise the decision-making procedure by joining sales trends with in-store behavior analytics that measure the flow of traffic and at-shelf behaviors of actual shoppers. The above data then powers research that can be utilized to establish rules for best practices to be used in enhancing displays across several stores or retailers